Data Visualization Tool Highlights California’s Slowing Population Growth Since 1990s
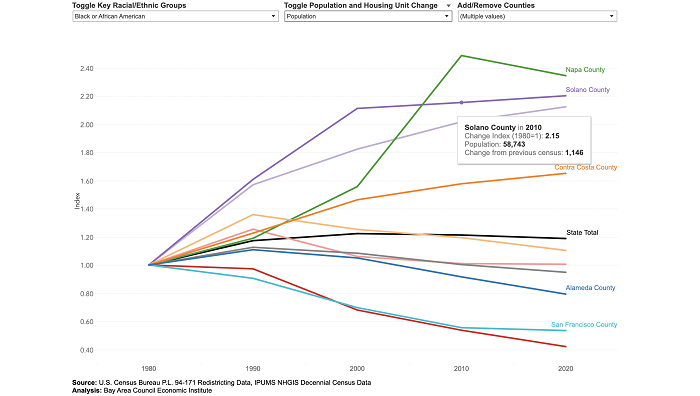
A new visualization tool created by the Bay Area Council Economic Institute tracking California’s demographic trends by county based on U.S. census data from 1980 – 2020 shows the state’s overall population has been slowing for decades, not just in the last two years in response to the COVID pandemic. While the state added 2.3 million people overall since 2010, specific demographic trends have continued on the same trajectory decade-over-decade since the 1990s.

The recent growth is attributed to a dramatic increase in the Latinx and Asian populations, which account for 69% of California’s total population growth. The white population has lost 1 million people on average every decade since 1990, and shrank by 8% between 2010 – 2020. The state continues to lose its Black population, largely due to decreases within the top six counties with the largest share of Black people. Learn more and see how demographics have changed in your county>>


